

Technical analysis involves the use of charts and indicators to predict future price movements of securities. One of the indicators used in technical analysis is the SMI Ergodic Indicator.
In this blog post, we will explain the SMI ergodic indicator, its components, and how it works. We will also compare the SMI Ergodic Indicator with other indicators and explain its advantages in trading decisions.
What is SMI Ergodic Indicator?
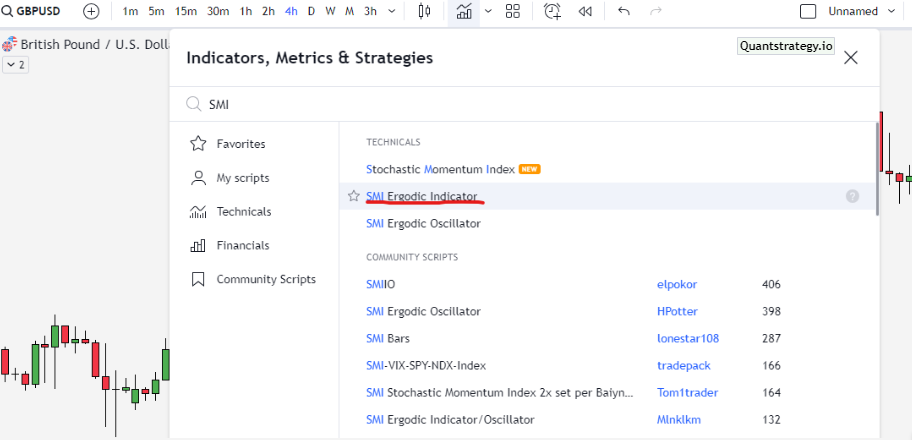
The SMI (stochastic momentum index) Ergodic indicator is a technical analysis tool that predicts trend reversals in the price of an asset by measuring the ratio between the smoothed price change and the smoothed absolute price change of a certain number of previous periods.
It is calculated in a similar way as the True Strength Index but with added benefits such as a signal line (an exponential moving average of the SMI Ergodic line) and double smoothing. The Ergodic indicator helps identify long trends in prices and is considered accurate for predicting overbought or oversold extremes, which are used as trading signals. The SMI indicator readings range from -100 to 100.
SMI Ergodic Indicator Formula
The formula for calculating the SMI Ergodic Indicator involves several steps. Here’s a step-by-step breakdown:
- Calculate the price change and absolute values of change for one bar period:
change = close – previous close
absolute change = Abs (change)
where:
the close is the current bar closing price and the previous close is the previous bar closing price.
- Calculate the First EMA (EMA change1) of the change:
EMA change1 = EMA(change, Length1)
Then calculate the First EMA (EMA abs change1) of the absolute change:
EMA abs change1 = EMA(absolute change, Length1)
Where:
EMA = Exponential Moving Average
Length1 = The length of the first EMA, usually set to 4
- Calculate the Second EMA (EMA change2) of the EMA change
EMA change2 = EMA(EMA change1, Length2)
Then calculate the Second EMA (EMA abs change2) of the EMA abs change1 :
EMA abs change2 = EMA(EMA abs change1, Length2)
Where:
Length2 = The length of the second EMA, usually set to 7
- Calculate the Stochastic Momentum Index as a ratio between EMA change2 and EMA abs change2:
SMI = EMA change2 / EMA abs change2
- Calculate the Signal line (Signal) for the SMI:
Signal = EMA(SMI, Length3)
Where:
Length3 = The length of the Signal line, usually set to 4
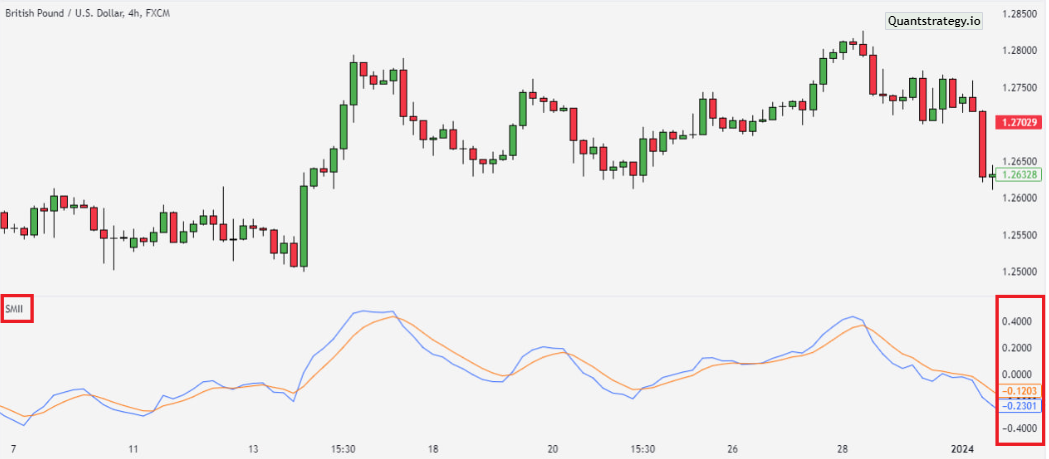
The resulting value of the SMI Ergodic Indicator oscillates between positive and negative values, indicating overbought and oversold conditions in the market.
Traders often use crossovers and divergences between the SMI and Signal lines as trading signals to identify potential trend reversals or continuation patterns.
How to use SMI Ergodic Indicator in Trading?
First, determine the trend direction of the stock or financial instrument you are trading using a long-term moving average or other trend-following indicators. This will help you identify whether the trend is bullish or bearish.
It is important to have a clear understanding of the trend direction before looking for buy or sell signals from the SMI Ergodic Indicator.
Secondly, you may want to keep an eye on the SMI Ergodic Indicator for buy or sell signals, which can be identified by observing the chart of this oscillator. When the SMI line crosses above the signal line, it generates buy signals, while a cross below the signal line creates sell signals.
When an asset is overbought, means that the price has risen too far and too fast, which may indicate that the asset is due for a reversal. Similarly, when an asset is oversold, meaning that the price has fallen too far and too fast, which may indicate that the asset is due for a reversal to the upside.
It’s important to note that this indicator alone should not be relied on to make trading decisions. Other technical analysis tools, such as chart patterns, volume indicators, or double moving averages, should be used to confirm the signal before placing a trade. Also, taking into account the previous price action and market trends can provide additional insights into the strength of the signal.
To make more accurate trading decisions, it is critical to employ different indicators and analysis tools. You can enter a trade once you have validated the signal and understood the trend direction.
Trade Example:
Suppose you are trading Apple Inc. (AAPL) and have determined that the trend is bullish based on a long-term moving average. You then look at the stochastic momentum index Ergodic Indicator and see that the signal line has crossed above the trigger line, generating a buy signal. To confirm the signal, you look at the chart and see that the stock is trading above its 20-day moving average and has formed a bullish engulfing pattern. Based on this analysis, you decide to enter a long position on AAPL.
SMI Ergodic Indicator vs. Relative Strength Index (RSI)
Another momentum oscillator used in technical analysis is the Relative Strength Index (RSI). The RSI is a technical indicator that monitors the change in price movements.
The RSI scale is 0-100, with overbought conditions happening above 70 and oversold conditions occurring below 30. The SMI Ergodic Indicator and the RSI have comparable properties, however, the SMI Ergodic Indicator provides more trustworthy signals.
The SMI Ergodic Indicator also delivers more distinct signals of bullish and bearish divergences and overbought and oversold levels.
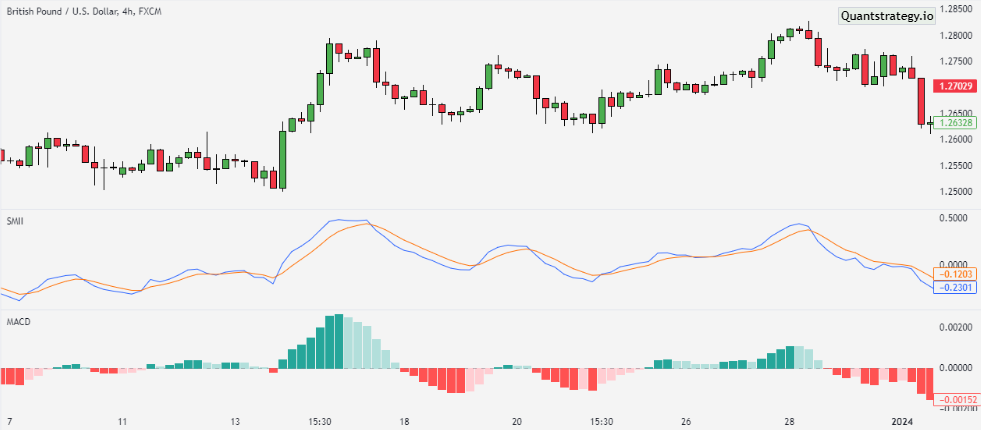
SMI Ergodic Indicator vs. Moving Average Convergence Divergence (MACD)
Another momentum oscillator uses in technical analysis is the Moving Average Convergence Divergence (MACD). The MACD is a technical indicator that evaluates the difference between two moving averages of various periods.
The SMI Ergodic Indicator and the MACD have comparable properties, however, the SMI Ergodic Indicator provides more dependable indications. The SMI Ergodic Indicator also delivers more distinct signs of bullish and bearish divergences and overbought and oversold levels.
Conclusion
The SMI Ergodic oscillator is a type of momentum indicator that can help traders determine whether a stock is overbought or oversold. The SMI Ergodic Indicator generates more consistent signals than RSI or MACD.
Traders can make better trading decisions using the SMI Ergodic Indicator in conjunction with other technical indicators and chart patterns.
